
Net operating income (NOI) for an accessory dwelling unit is the annual rental income remaining after all operating expenses, excluding debt service and taxes. It is the core metric for evaluating ADU rental profitability and investment performance. Gross rent tells you what a tenant pays. NOI tells you what the property actually earns. Lenders, appraisers, and investors all rely on NOI as the standard measure of income property value. Understanding ADU net operating income explained correctly means separating it from cash flow, which subtracts financing costs, and from gross rent, which ignores expenses entirely.
How to calculate net operating income for an ADU
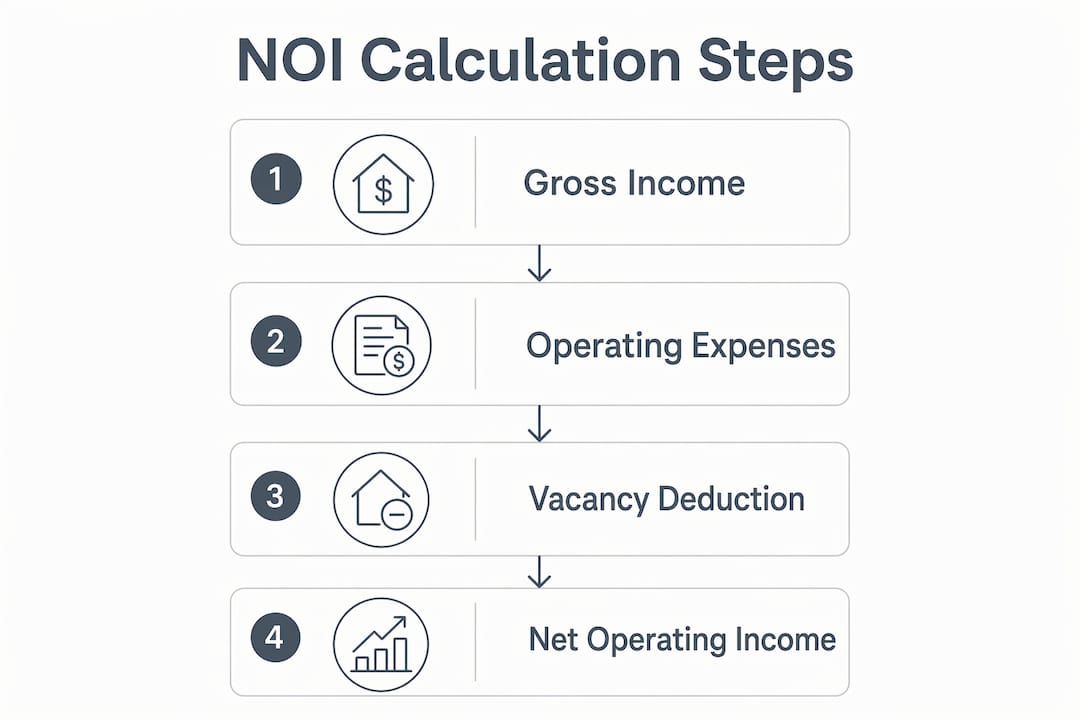
The NOI formula is straightforward: Gross Rental Income minus Total Operating Expenses equals NOI. Applying it accurately to an ADU requires knowing which costs belong in the calculation and which do not.
Step-by-step NOI calculation
- Establish gross rental income. Start with the annual rent your ADU generates at full occupancy. A unit renting for $2,000 per month produces $24,000 in gross annual income.
- Apply a vacancy reserve. Vacancy reserves for ADUs typically run 5–7% of gross income. On $24,000, a 6% vacancy reserve equals $1,440, reducing effective gross income to $22,560.
- Subtract operating expenses. Operating expenses for ADUs typically range from 15% to 30% of gross annual income, covering maintenance, insurance, and management. That range reflects real variation across markets and ADU types.
- Calculate NOI. Subtract total operating expenses from effective gross income. Using a 22% expense ratio on $24,000 gross income produces $5,280 in expenses. NOI equals $22,560 minus $5,280, or $17,280 annually.
- Verify what NOI excludes. NOI does not subtract mortgage payments, income taxes, or depreciation. Those adjustments produce net cash flow and taxable income, which are separate calculations.
A concrete example clarifies the difference. A detached ADU generating $2,000 per month in gross rent looks attractive on paper. After vacancy and operating expenses, the actual ADU income calculation may land closer to $1,400 per month in NOI. That gap matters enormously when sizing a loan or projecting returns.
Pro Tip: Never confuse NOI with net cash flow. Debt service consumes NOI to produce cash flow, and financing costs can turn a positive NOI into negative monthly cash flow when loan payments are high.

How do lenders treat ADU income when underwriting loans?
Lenders apply conservative rules to ADU rental income. They do not count the full gross rent when calculating your qualifying income.
The two key underwriting limits investors need to know:
- 75% income cap. Fannie Mae underwrites ADU income at 75% of gross market rent, not 100%. On $2,000 per month gross rent, only $1,500 counts toward qualifying income.
- 30% household income limit. ADU rental income typically cannot exceed 30% of total household qualifying income. A borrower with $5,000 per month in qualifying wages can count at most $1,500 in ADU income, which happens to align with the 75% cap in this example.
- Limited historical data. Lenders apply these caps because ADU rental markets lack the decades of performance data that single-family or multifamily markets carry. The conservative approach protects lenders from overestimating income stability.
- Impact on loan sizing. These caps directly reduce the loan amount you qualify for. Investors who plan projects assuming full gross rent counts toward debt-to-income ratios often find their financing falls short.
Lenders underwrite ADU income conservatively because the asset class is relatively new and rental consistency data is limited. Building your financial model on 75% of gross rent, not 100%, produces projections that survive lender scrutiny and reflect real-world qualification limits.
Understanding these limits before you build is critical. Investors who plan ADU financing around full gross rent often discover the qualifying income shortfall only after construction is complete.
What operating expenses are unique to ADUs?
ADU operating expenses differ from standard rental property costs in several ways. The unit’s small size, shared lot, and owner-managed nature create expense patterns that standard rental models miss.
Typical ADU expense line items
| Expense Category | Typical Annual Cost | Notes |
|---|---|---|
| Routine maintenance | $1,500–$3,000 | Appliances, HVAC, plumbing |
| Tenant turnover cleaning | $200–$350 per turnover | Higher frequency in short-term rentals |
| Insurance increase | Varies by policy | Typically added to existing homeowner policy |
| Vacancy reserve | 5–7% of gross income | Standard buffer for rental gaps |
| Management or self-management | 8–10% of gross income | Applies even if owner self-manages |
The self-management line surprises most first-time ADU investors. Self-management time carries an opportunity cost estimated at 8–10% of gross revenue. Ignoring it overstates NOI and produces projections that do not survive contact with reality.
- Detached ADUs carry higher maintenance costs but command stronger rents and resale premiums. Their payback periods run longer, but absolute returns are higher.
- Garage conversions offer faster payback with lower upfront costs, but rental income and resale lift are more modest.
- Permitting status affects every expense category indirectly. An unpermitted ADU may generate gross rent, but lenders will not count that income, and appraisers will not credit the unit’s value.
Pro Tip: Budget a realistic reserve fund covering at least one month of gross rent annually. Unexpected repairs on a small unit hit harder as a percentage of income than the same repair on a larger property.
The expense ratio you use in your NOI model should reflect your specific ADU type, management approach, and local market. Using a flat 15% because it produces a better-looking return is the fastest way to build a cash-flow trap.
How does NOI affect ADU valuation and investment returns?
NOI is not just an income metric. It directly drives property appraisal value and total investment return across three distinct channels.
The three pillars of ADU return
ADU investment returns rest on three pillars: monthly NOI cash flow, long-term equity appreciation through higher appraisal, and tax benefits from depreciation schedules. Ignoring any one pillar produces an incomplete picture of true ROI.
The appraisal impact is the most underappreciated pillar. Permitted detached ADUs increase property appraisal value by 1.30 to 1.40 times build cost. An ADU that costs $150,000 to build may add $195,000 to $210,000 in appraised value. Unpermitted units, by contrast, add little to no appraised value. That gap is not a technicality. It determines whether a future buyer can finance the purchase with the ADU income counted, which directly affects your exit options and resale price.
The ADU resale impact compounds over time. Equity lift from a permitted ADU builds from day one, independent of whether you carry a loan. Financing affects monthly cash flow but does not reduce the appraisal-based equity gain.
Tax benefits add a third return layer. Component-level cost segregation of ADU construction allows investors to optimize depreciation timing and capture clearer early-year performance data. Depreciation reduces taxable income without reducing NOI, making it a genuine return enhancer that most investors undercount.
A 10-year model combining NOI cash flow, equity appreciation, and depreciation benefits consistently outperforms a model that looks only at monthly rent minus mortgage payment. The spread between those two analyses is where informed investors find their edge.
Key Takeaways
Accurate ADU NOI calculation requires combining realistic expense ratios, vacancy reserves, and lender underwriting limits to produce projections that hold up in the real world.
| Point | Details |
|---|---|
| NOI formula | Gross rental income minus operating expenses, excluding debt service and taxes. |
| Operating expense range | ADU expenses typically run 15–30% of gross income, including vacancy and management. |
| Lender income cap | Fannie Mae counts only 75% of gross ADU rent toward qualifying income. |
| Permitting drives value | Permitted ADUs add 1.30–1.40 times build cost to appraised value; unpermitted units add near zero. |
| Three return pillars | Monthly NOI, appraisal equity lift, and depreciation benefits each contribute to total ROI. |
Why I think most ADU investors look at the wrong number first
Investors almost always lead with construction cost. I understand why. It is the biggest check you write, and it feels like the defining variable. But construction cost is a sunk cost the moment you break ground. The number that actually determines whether your ADU investment works is the spread between your cost of capital and the yield your NOI produces.
I have seen investors build beautiful, well-permitted detached ADUs and still end up with negative monthly cash flow because they modeled gross rent instead of NOI, and they did not account for the 75% lender income cap when sizing their construction loan. The unit performed exactly as the market predicted. The financial model just did not reflect reality.
The fix is not complicated. Build your model on NOI, not gross rent. Include self-management as a real expense line. Use 75% of gross rent as your qualifying income assumption. Then stress-test the model at a 7% vacancy rate instead of 5%. If the project still pencils, you have a real investment. If it only works at optimistic assumptions, you have a hope, not a plan.
Permitting is non-negotiable in my view. The difference between a permitted and unpermitted ADU is not just regulatory compliance. It is the difference between an asset a lender will finance and an asset that exists only on your personal balance sheet. That distinction affects your liquidity, your exit options, and your ability to refinance. No short-term cost savings on permits justifies that trade-off.
Track your expenses at the component level from the start. Maintenance, turnover, insurance, and management each tell you something different about your property’s performance. Aggregating them into a single “expenses” line makes it impossible to identify where your NOI is leaking.
— Rudy
ADU investment planning resources from Live Large™
Regulatory changes in Florida are reshaping ADU investment math in real time. Tampa’s recent accessory dwelling unit policy reforms and Pasco County’s ADU approval program have opened new markets for investors who understand how local policy affects NOI calculations, lender acceptance, and appraisal outcomes.
Live Large™ covers these policy shifts and their direct impact on financing and returns. Whether you are evaluating your first ADU project or refining the financial model on an existing unit, Live Large™ provides current guides on construction, financing, and investment performance specific to the Florida market and beyond.
FAQ
What is ADU net operating income?
ADU net operating income is the annual rental income remaining after all operating expenses, excluding debt service and taxes. It is the standard metric for measuring rental property profitability before financing costs are applied.
What operating expense ratio should I use for an ADU?
Operating expenses for ADUs typically range from 15% to 30% of gross annual income, depending on ADU type, management approach, and local market conditions. A 20–25% ratio is a reasonable starting point for most detached units.
How do lenders calculate qualifying income from an ADU?
Lenders typically count 75% of gross market rent as qualifying ADU income, and that income generally cannot exceed 30% of total household qualifying income. These caps reflect conservative underwriting standards for a relatively new asset class.
Does permitting really affect ADU appraisal value?
Permitted ADUs increase appraised property value by 1.30 to 1.40 times build cost. Unpermitted units add little to no appraised value, which eliminates lender income credit and limits resale options for future buyers.
What is the difference between NOI and cash flow for an ADU?
NOI measures income after operating expenses but before debt service. Cash flow subtracts mortgage payments from NOI. A property can show positive NOI and still produce negative monthly cash flow if financing costs are high.